Asset allocation

At 31 December 2017, total investments amounted to € 474,502 million, up by 3.2% over the previous year. Group investments amounted to € 399,130 million (+1.6%) and unit/index linked investments amounted to € 75,372 million (+11.9%).
In implementation of the Responsible Investment Guideline - the document which regulates the various responsible investment activities at Group level - we identify, evaluate and monitor issuing companies in the portfolio which are involved in controversial sectors (for example, non-conventional weapons) or in activities that involve serious or systematic violations of human rights, serious environmental damage or corruption. Due to the creation of a proprietary ESG methodology - which considers environmental, social and corporate governance factors - we evaluate the degree of responsibility and involvement of the issuing companies and promote specific actions with respect to them, ranging from a ban on making new investments to the settlement of current holdings or the retention of same until their expiration with no possibility of renewal, or even direct dialogue to encourage them to act responsibly. A cross-functional committee named Responsible Investment Committee retains the task of supporting the decisions of the Group Chief Investment Officer in relation to potential exclusions from the investable universe of the Group.
Climate strategy
In line with the principles of responsible investing which we have been applying for years, and in execution of the Group Policy for the Environment and Climate, we have defined our commitment, even through investment activities, to mitigate climate change and transition towards energy sources as alternatives to carbon and fossil fuels.
Our rules for running business with integrity
Sustainable and responsible investment funds
Due to a methodology developed internally by a dedicated team - which integrates non-financial and traditional financial elements - we select the best companies in relation to corporate social responsibility and sustainable development policies in order to establish dedicated SRI (Sustainable and Responsible Investment) funds and mandates.
As at 31 December 2017, the methodology was applied to funds and management mandates totalling € 37.2 billion in assets (+21.2%). Of these, 76.3% was subject to the SRI analysis and reported a compliance rate of more than 90% with the Group's SRI principles. The remaining 23.7% is not covered by the SRI analysis (funds of funds, issuers located in non-European regions, unlisted issuers)
www.generali-investments.com/it/it/institutional/strategies/#isr
In terms of incidence of the major investment categories, the relevant exposure of the fixed income instruments dropped to 87.1% (88.2% at 31 December 2016), while that of the equity instruments increased slightly, standing at 4.6% (4.5% at 31 December 2016). Also the incidence of the real estate and other investments increased slightly, standing at 3.8% (3.7% at 31 December 2016) and at 1.1% (0.9% at 31 December 2016), respectively. Other investments mainly include receivables from banks or banking customers, equity investments and derivatives.
Lastly, the liquidity ratio rose from 2.7% to 3.4%.
Fixed income securities: bond portfolio

With reference to the bond portfolio, government bonds which represent 57% (54.8% at 31 December 2016) were up, standing at € 180,905 million (€ 172,647 million at 31 December 2016). The change during the period is mostly attributable to the Group’s position of net buyer of this class of assets. The exposure to individual government bonds is mainly allocated to the respective countries of operation, in line with the Group’s ALM policy.
The corporate component decreased in absolute terms to € 136,579 million (€ 142,528 million at 31 December 2016), equal to 43% of the bond portfolio (45.2% at 31 December 2016). This was due to the orientation of the reinvestment strategy toward the sovereign bond component.
Taking into consideration, on the other hand, the new current breakdown of the portfolio, note that the non-financial component increased in order to foster a higher level of diversification.
The bonds issued by companies operating in the Real Estate sector were included in the scope of the Other corporate bonds.
A breakdown by credit rating of the bond portfolio at 31 December 2017 split between corporate and government bonds follows.

The Group’s Corporate portfolio is still basically in line with what was recorded at 31 December 2016 in terms of creditworthiness, with over 91% of securities held classified as Investment Grade.
Exposure to bonds with BBB rating increased slightly, while all the other classes decreased in absolute terms against the scheduled portfolio reduction during 2017.
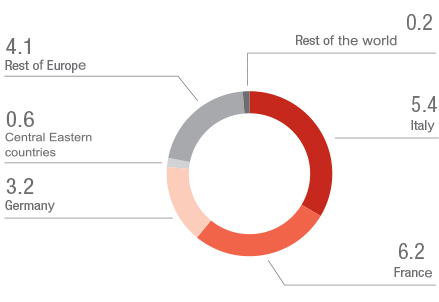
Equity securities: share portfolio
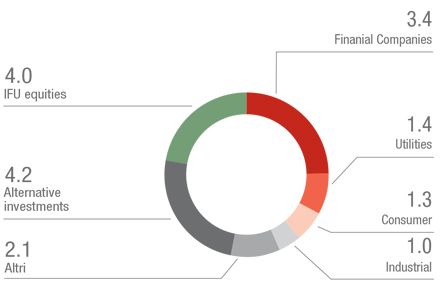
Equity securities increased in absolute terms, standing at € 18,403 million (€ 17,680 million at 31 December 2016).
The change for the period is mainly attributable to the increased value of the investments that benefited from the positive performance of the share prices, and to a lesser extent for the conversion of some bonds into shares.
Investment properties
Investment properties in terms of book value amounted to € 15,018 million (€ 14,488 million at 31 December 2016).
In particular, the direct investment properties of the Group, at market value, amounted to € 19,763 million (€ 18,520 million at 31 December 2016), and are almost all in Western Europe, mainly in Italy, France and Germany, and are situated in the respective countries of operation.
Investment result1
Return on investiment
| 31/12/2017 | 31/12/2016 | |
|---|---|---|
| Economic components | ||
| Current income from fixed income instruments | 10,399 | 10,664 |
| Current income from equity instruments | 691 | 704 |
| Current income from real estate investments(*) | 802 | 775 |
| Net realized gains | 2,652 | 2,166 |
| Net impairment losses | -432 | -1,133 |
| Net unrealized gains | 449 | -395 |
| Average stock | 395,098 | 392,194 |
| Ratio | ||
| Current return(*) | 3.1% | 3.2% |
| Harvesting rate | 0.7% | 0.2% |
| P&L return | 3.4% | 3.3% |
(*) Net of depreciation of the period.
Current return slightly fell to 3.1% (3.2% at 31 December 2016). The performance of this indicator is attributable on the one hand to the increase in average investments and, on the other, to a drop in absolute value of current income, which amounted to € 12,089 million (€ 12,386 million at 31 December 2016) due to the low interest rates that can be obtained when reinvesting.
The contribution to the result of the period from realized gains and losses through profit or loss (harvesting rate) increased to 0.7% (0.2% at 31 December 2016) following an increase in realized gains and a lower impact of impairments, which were particularly substantial at 31 December 2016.
1 Please refer to the methodological notes attached to this report for details on the calculation of this indicator.